
Monitor Your Cloud Lab for Free with Netdata: Real-Time Metrics & Alerts
How I get sub-second visibility on $5/mo servers without breaking the bank

“BetweentheClouds 1300+ subscribers: 25% discount offer”
I’ve been running my home lab in the cloud on shoestring budgets for years, and one of the biggest challenges I faced was getting meaningful, real-time insights into what my servers were doing—especially when I was cramming multiple services onto tiny $5–$10/month instances. Traditional monitoring stacks like Prometheus + Grafana are powerful, but they can be heavy to manage and eat into my limited resources. That’s when I discovered Netdata.
In this post, I’ll walk you through how I set up Netdata on a low-cost cloud VM, what makes it perfect for lean environments, and share my favorite tips, tricks, and configurations. Whether you’re monitoring a handful of VMs or a small Kubernetes cluster, Netdata gives you enterprise-grade metrics and alerts—often without spending a dime.
Why Netdata?
When I first saw Netdata in action, I couldn’t believe the level of detail it provided on a single tiny VM:
Sub-second granularity: Netdata collects hundreds of metrics every second with near-zero overhead.
Lightweight footprint: The core agent uses just a few percent of CPU and a few dozen megabytes of RAM, even under load
Zero-config dashboards: Once installed, you get instant charts for CPU, disk I/O, network, processes, containers, and more
Built-in integrations: Native support for Docker, Kubernetes, MySQL, Redis, AWS, Azure, and dozens of other services
Free core + generous cloud tier: Netdata Cloud lets you link multiple nodes and view them centrally for free up to hundreds of hosts
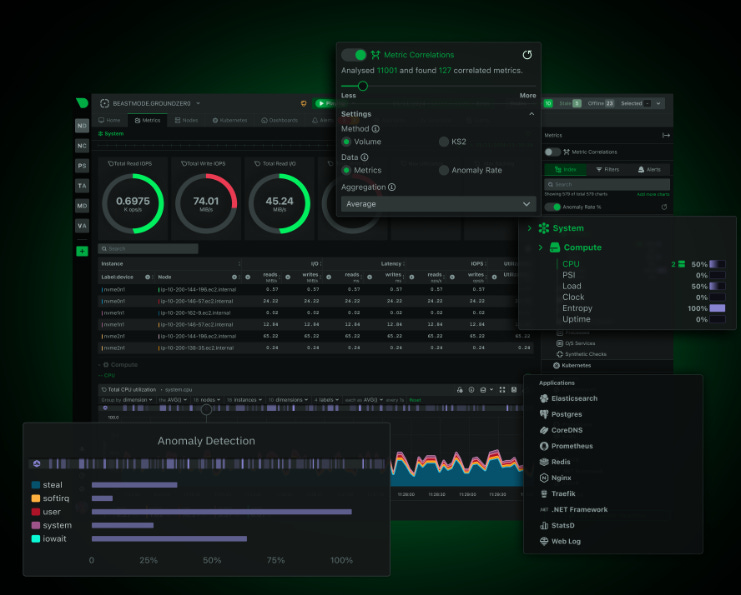
I’ve caught everything from sudden CPU steal spikes on spot instances to memory leaks in containerized services. You can see all of this in real time, without having to bulk up my instances.
Getting Started in 5 Minutes
Sign up for Netdata for free. Then simply install the agent on your cloud VM resources.
Take for instance a cloud VM
Open ports TCP 19999 (Netdata dashboard) and UDP 8125 if you’ll use StatsD.
Install Netdata with one command
wget -O /tmp/netdata-kickstart.sh https://get.netdata.cloud/kickstart.sh && sh /tmp/netdata-kickstart.sh --stable-channel --claim-token <your claim token> --claim-rooms <your claim room> --claim-url https://app.netdata.cloud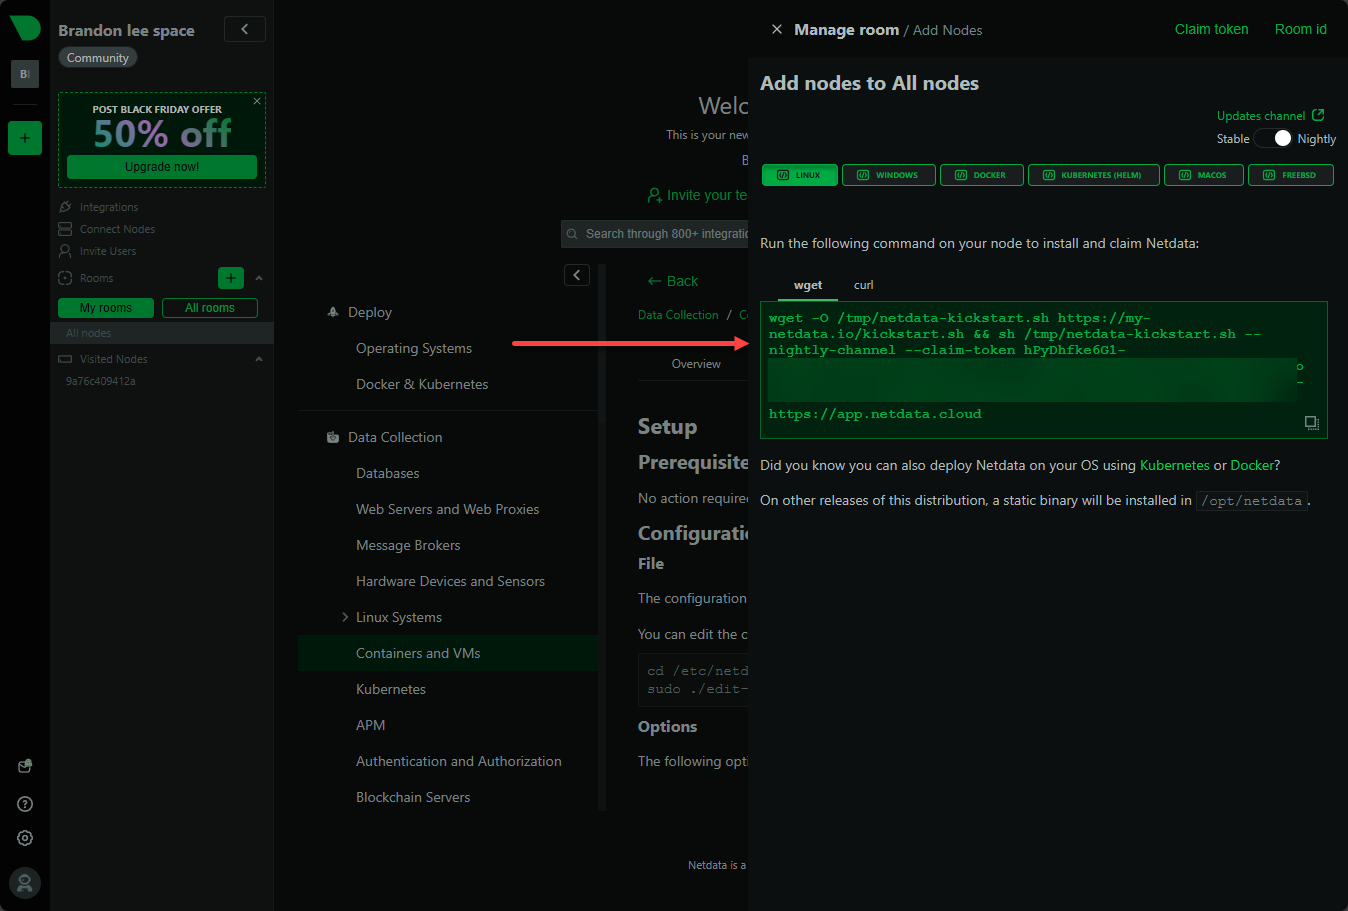
(curl -Ss https://my-netdata.io/kickstart.sh)This script handles all dependencies and will launch the Netdata service
Just a few seconds for the telemetry data to start streaming into your Netdata dashboard from your server
You can also navigate to
http://<your-vm-ip>:19999/on the server itself and watch the live charts populate on the local server dashboard
That’s it! With this process you’re collecting metrics in real time, without touching any config files.
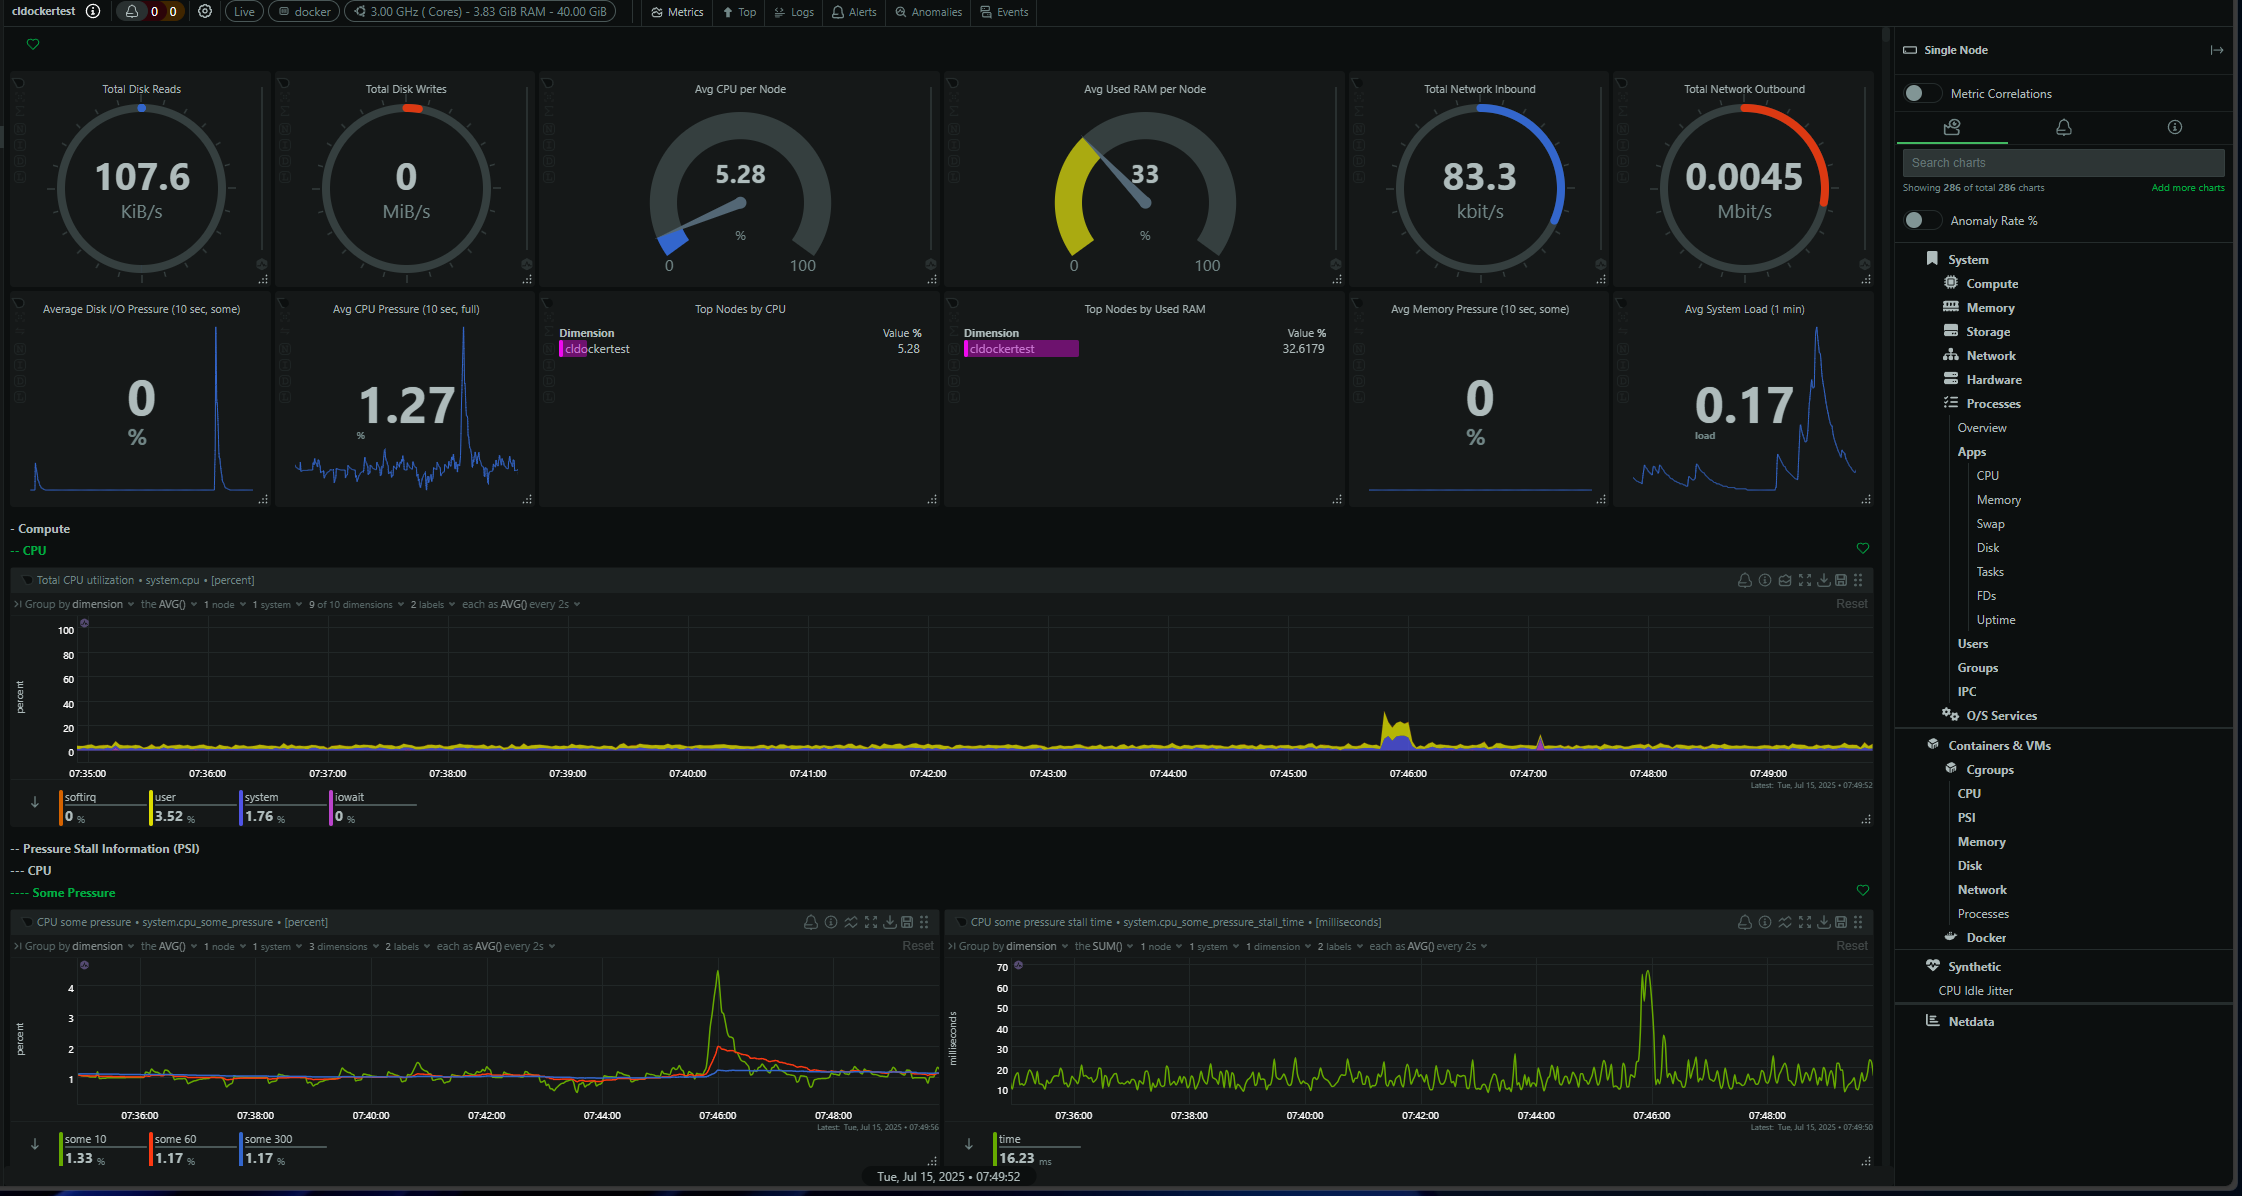
Key features for cloud labs or production workloads
Netdata excels in lightweight cloud environments thanks to features that fit small-instance constraints:
Cloud provider metrics
Pull native AWS CloudWatch, Azure Monitor, or GCP Stackdriver data alongside host metrics
Compare your VM’s CPU steal against CloudWatch’s CPU credit balance to catch burst-credit exhaustion
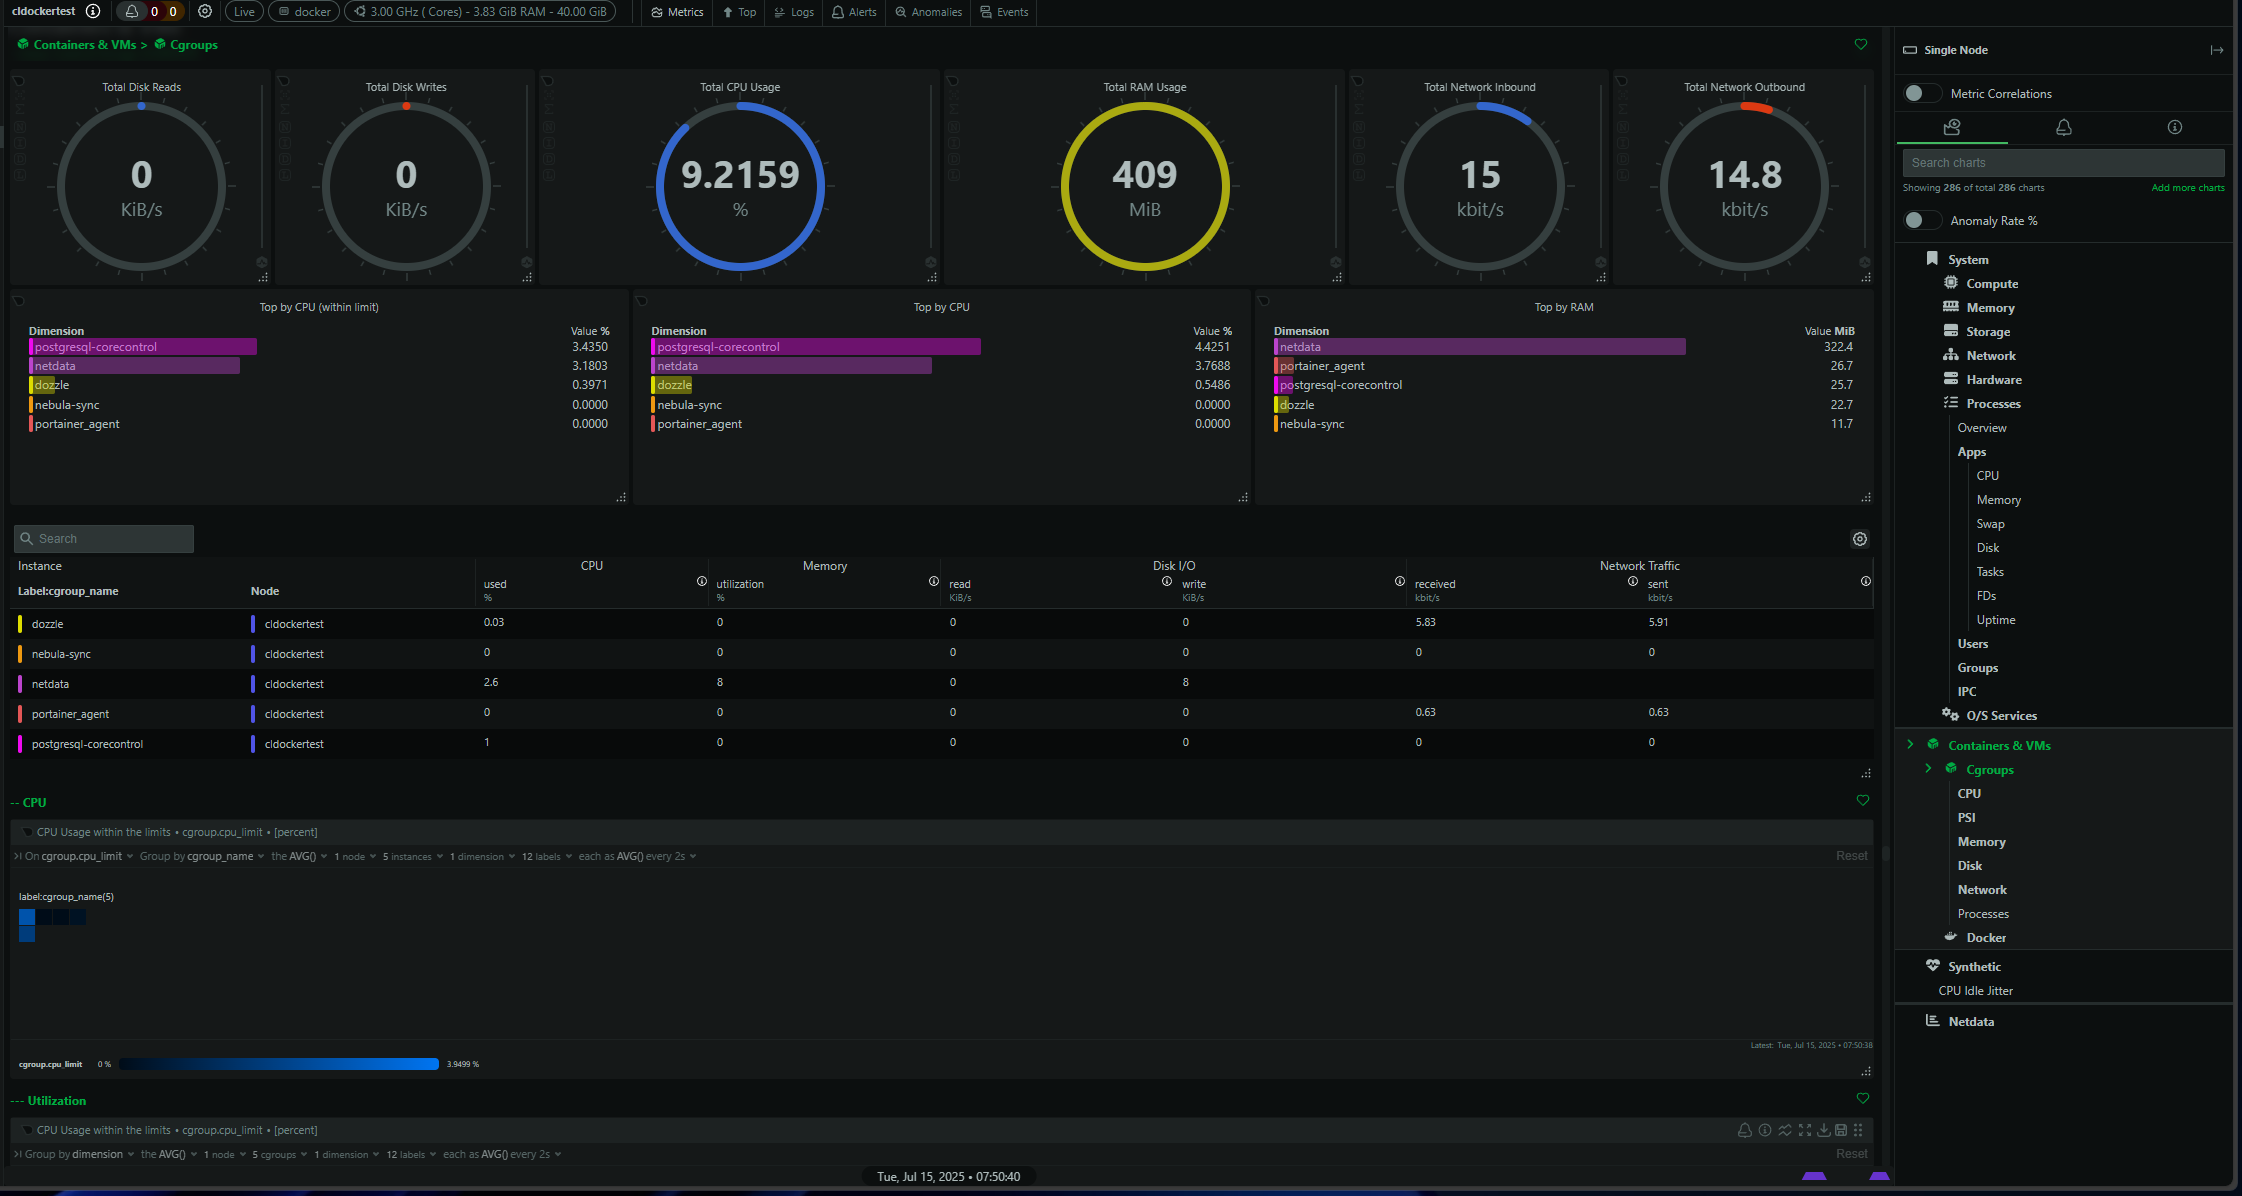
Container & orchestration support
Auto-detect Docker containers and Kubernetes pods
Drill down into per-container CPU, memory, network, and disk I/O
Correlate host-level events with container-level anomalies
Real-time alerting
Define thresholds down to the second (e.g., “trigger if CPU utilization > 80% for 5s”)
Configure Slack, Discord, PagerDuty, email, or webhook notifications
Built-in anomaly detection flags unexpected metric behavior without you writing custom rules
Dashboard templating & embedding
Save custom dashboard layouts and share via links
Embed individual charts into team wikis or runbooks with simple
<iframe>snippets
Cost Breakdown & Sizing
Even on the tiniest instances, Netdata runs smoothly, but here’s what I recommend for different fleet sizes:
Small fleets (1–5 hosts): I stick with a 1 vCPU, 512 MB RAM instance—such as AWS’s t3a.nano or GCP’s f1-micro—which clocks in at about $5/month.
Medium fleets (5–20 hosts): Bumping up to 1 vCPU and 1 GB RAM (t3a.small or e2-small) gives a bit more breathing room for both your services and Netdata, for roughly $10/month.
Larger fleets (20–50 hosts): At this scale, I move to 2 vCPU and 2 GB RAM (t3a.medium or e2-medium), which runs around $20/month.
Pro Tip: No self-hosted server needed. Each agent streams its data directly to Netdata Cloud. This means zero overhead for a monitoring back end, and you can view all your servers in one centralized, cloud-hosted dashboard without managing any extra infrastructure.
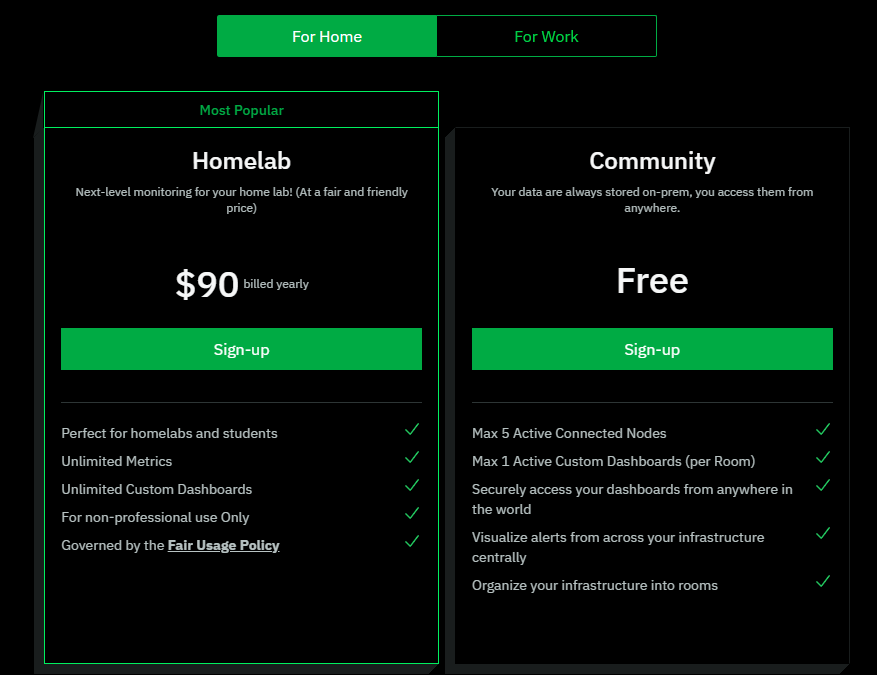
Best of all, Netdata Cloud’s free tier covers up to 100 connected nodes with 24-month retention on dozens of charts. This is perfect for most home labs and small teams. Also, there is a $90/yr “homelab” license you can take advantage of for unlimited nodes.
Check out the pricing link here: https://www.netdata.cloud/pricing/
Advanced tips and tricks with Netdata
To get the most out of Netdata in a lean cloud lab, I use these configurations:
Custom health alarms
charts:system.cpu
on: system.cpu
lookup: average -1m unaligned of system.cpu.user
units: %
every: 10s
warn: $this > 75
crit: $this > 90
Auto-scale your monitoring
Use Terraform or Ansible to provision new VMs with the Netdata kickstart script
In your CI/CD pipeline, trigger a job to register the new host with Netdata Cloud automatically
Optimize retention & disk usage
By default, Netdata stores recent raw metrics in RAM and older data on disk
Tweak
netdata.confto control disk cache size, or point to a mounted network volume if you need longer local retention
Embed charts in Slack or Teams
Set up a private dashboard link (
/api/v1/dashboard?id=...) and paste that into a notification messageUse Netdata’s built-in webhook integration to post snapshot images on alert triggers
When to consider you need more?
Netdata is ideal for real-time, sub-second visibility on small-scale environments. If you ever need:
Long-term archival analytics (beyond months of retention)
Highly customized, large-scale Prometheus pull-based scraping
Deep application tracing (APM-style)
…You might layer in Prometheus, Grafana, or commercial APM tools. But for my lean cloud lab, Netdata handles 99% of needs at near-zero cost.
Next Steps
Spin up your free Netdata Cloud account and link your first node in under 2 minutes.
Customize your health alarms using the cheat sheet’s templates.
Invite your team to the dashboard and embed key charts in your Slack channels or runbooks.
I’d love to hear how you’re using Netdata and what metrics matter most in your home or cloud lab? Hit reply and let me know!